Hyperliquid Whale Tracker
Track whale activity on Hyperliquid in real time. Monitor large trader positions, smart money flows, and liquidity movements to gain a competitive edge in crypto trading.
Sign up for freeHyperliquid Whale Tracker
Unlock professional-grade insights into large trader behavior on Hyperliquid with the Hyperliquid Whale Tracker. This powerful analytics tool monitors major wallet activities in real time — tracking significant trades, position changes, and institutional-level movements that can signal upcoming market shifts.
The Hyperliquid Whale Tracker gives you transparency into smart money flow and whale positioning, enabling you to see exactly where large traders are deploying capital and how they are adjusting their risk exposure. Instead of guessing market direction from charts alone, you can follow the real actions of influential market participants and use those insights to inform your own strategy.
Key features include:
Real-time whale position tracking: Watch large wallets open, modify, or close positions with live updates.
Large trade alerts & analytics: Detect high-value trades and directional liquidity flows across the Hyperliquid exchange.
Market behavior insights: Understand how whales’ activities influence volatility, trends, and momentum — crucial for timing high-impact entry and exit points.
Smart Money Indicators: Gain a deeper look at the behavior of experienced and heavily funded traders — a leading sentiment signal beyond traditional technical analysis.
Whether you’re a seasoned trader or data-driven investor, the Hyperliquid Whale Tracker transforms opaque market movements into actionable insights — helping you anticipate market swings and align with or counter major trading flows.
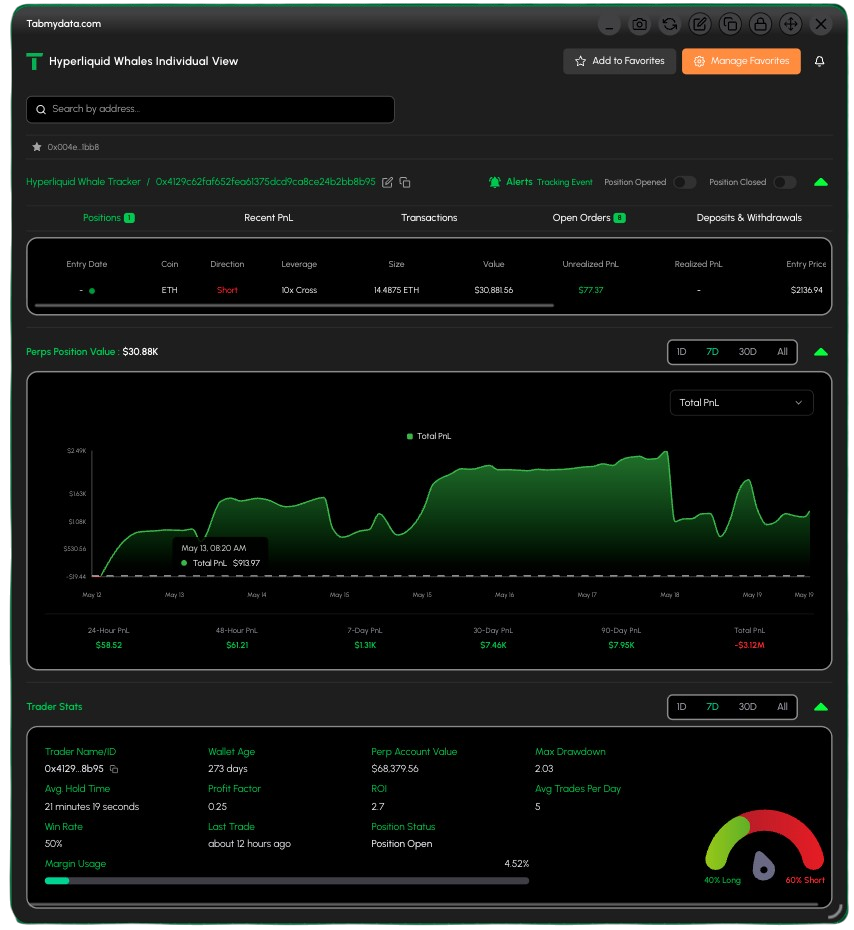
Trade Data Tabs
5 tabs: Positions, Recent PnL, Transactions, Open Orders, Deposits & Withdrawals