Liquidity Heatmap (Multi-Exchange Aggregation)
The First True Multi-Exchange Liquidity Heatmap
Sign up for freeLiquidity Heatmap (Multi-Exchange Aggregation)
See the market as it actually exists—not fragmented across exchanges, but unified into one clear view.
Tabmydata’s Liquidity Heatmap streams real-time order book data from 10+ exchange APIs simultaneously, aggregating global liquidity into a single chart—a first-of-its-kind capability in the industry.
This is not a lagging indicator.
This is not simulated data.
This is live, executable liquidity—showing exactly where orders are placed, stacked, pulled, and absorbed across the market.
Identify:
True multi-exchange support & resistance zones
Hidden liquidity walls and spoofing behavior
Liquidity gaps where price can move aggressively
Real-time absorption and market intent
Instead of guessing where price might react, you see where it must react.
Built for traders who understand that price is not the signal— liquidity is.
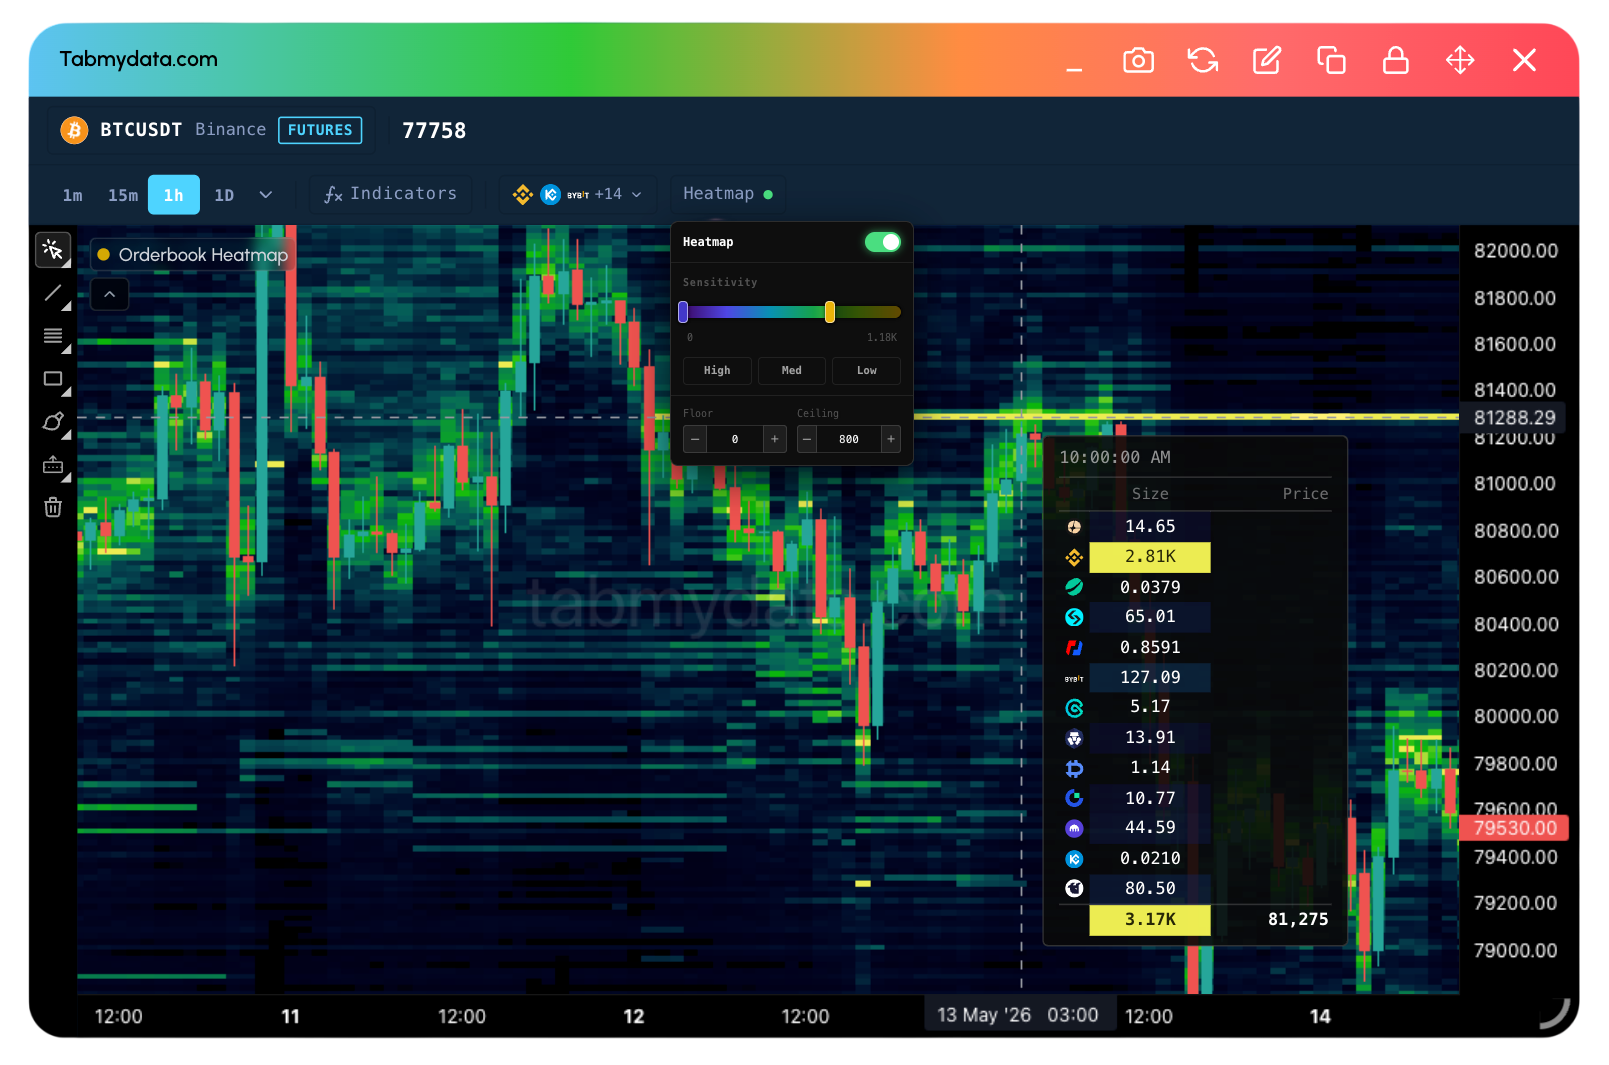
What is the Liquidity Heatmap?
The Liquidity Heatmap tab overlays real order book depth data on a price chart, showing where large clusters of buy and sell orders are concentrated at each price level over time. This helps you identify key support and resistance zones based on actual liquidity rather than price action alone.