Tabmydata Custom Charting & Indicators
Design a trading environment that moves at your speed.
Tabmydata combines a high-performance charting engine with a powerful suite of technical tools—giving you everything you need to analyze, adapt, and execute with precision.
Charting & Customization
Fully customizable chart layouts
Multi-timeframe analysis
Custom drawings & advanced technical tools
Clean, fast, execution-focused interface
Integrated Indicators
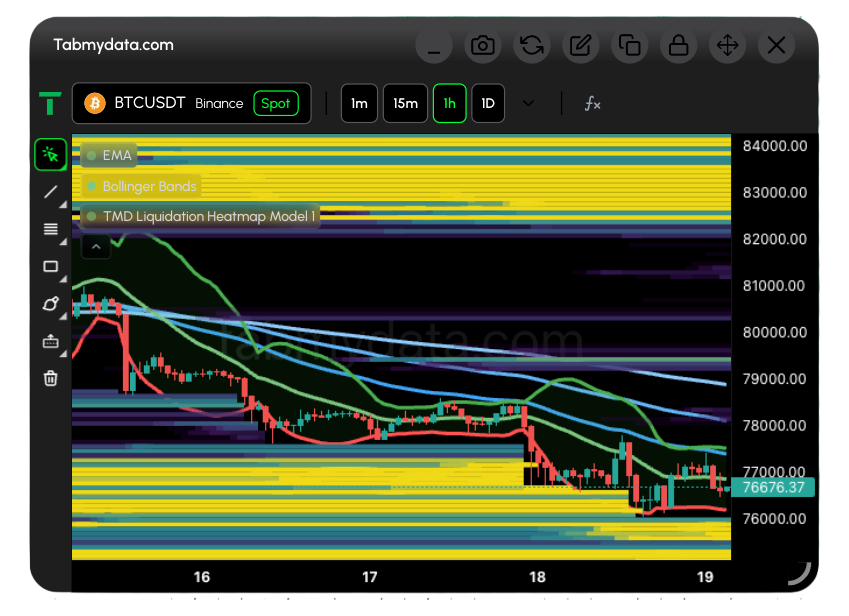
EMA → Track dynamic trend direction
Bollinger Bands → Identify volatility expansion & compression
Liquidation Heatmap Model → Visualize high-risk liquidation zones and cascading pressure
Every tool is designed to work together seamlessly—so you can build confluence, not clutter.
No distractions. No unnecessary complexity.
Just a refined system built for serious traders.
What is the Chart tab?
The Chart tab is a custom candlestick chart built in-house on lightweight-charts, streaming live data via WebSocket. It includes technical indicators, drawing tools, and the Liquidity Heatmap overlay.
Selecting an asset
Click the symbol selector in the top bar to choose your exchange and trading pair. Both Spot and Futures markets are supported. You can switch assets at any time without losing your indicator or drawing configuration.