Chart Tab
A high-performance candlestick chart built in-house with indicators, drawing tools, and real-time data.
What is the Chart tab?
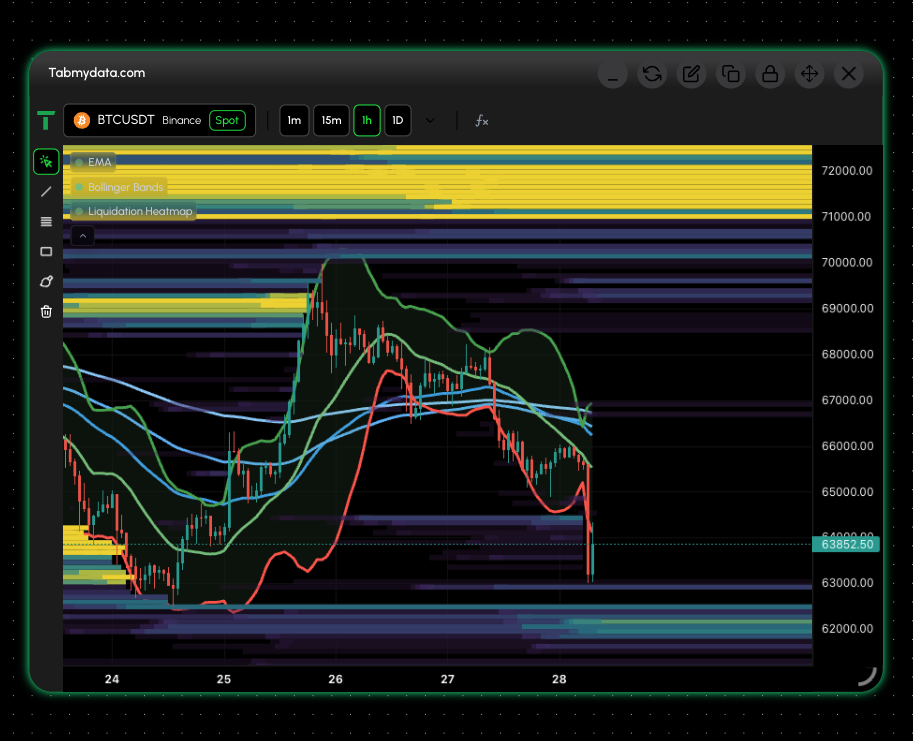
The Chart tab is a custom candlestick chart built in-house on lightweight-charts, streaming live data via WebSocket. It includes technical indicators, drawing tools, and the Liquidity Heatmap overlay.
Adding the tab
Click "+" in the workspace toolbar, then select Chart. The chart will appear on your workspace ready to configure.
Selecting an asset
Click the symbol selector in the top bar to choose your exchange and trading pair. Both Spot and Futures markets are supported. You can switch assets at any time without losing your indicator or drawing configuration.
Indicators
Open the indicator panel to add built-in studies to your chart:
• EMA — Exponential Moving Average with selectable period (50, 100, 200) • Bollinger Bands — volatility envelope with configurable length and multiplier • TMD Liquidation Heatmap Model 1 — visualises historical liquidation clusters with 12 colour themes
Multiple indicators can be active at the same time. Each indicator displays its current values in the legend overlay.