Orderbook Tab
See live bid and ask depth for any exchange and trading pair.
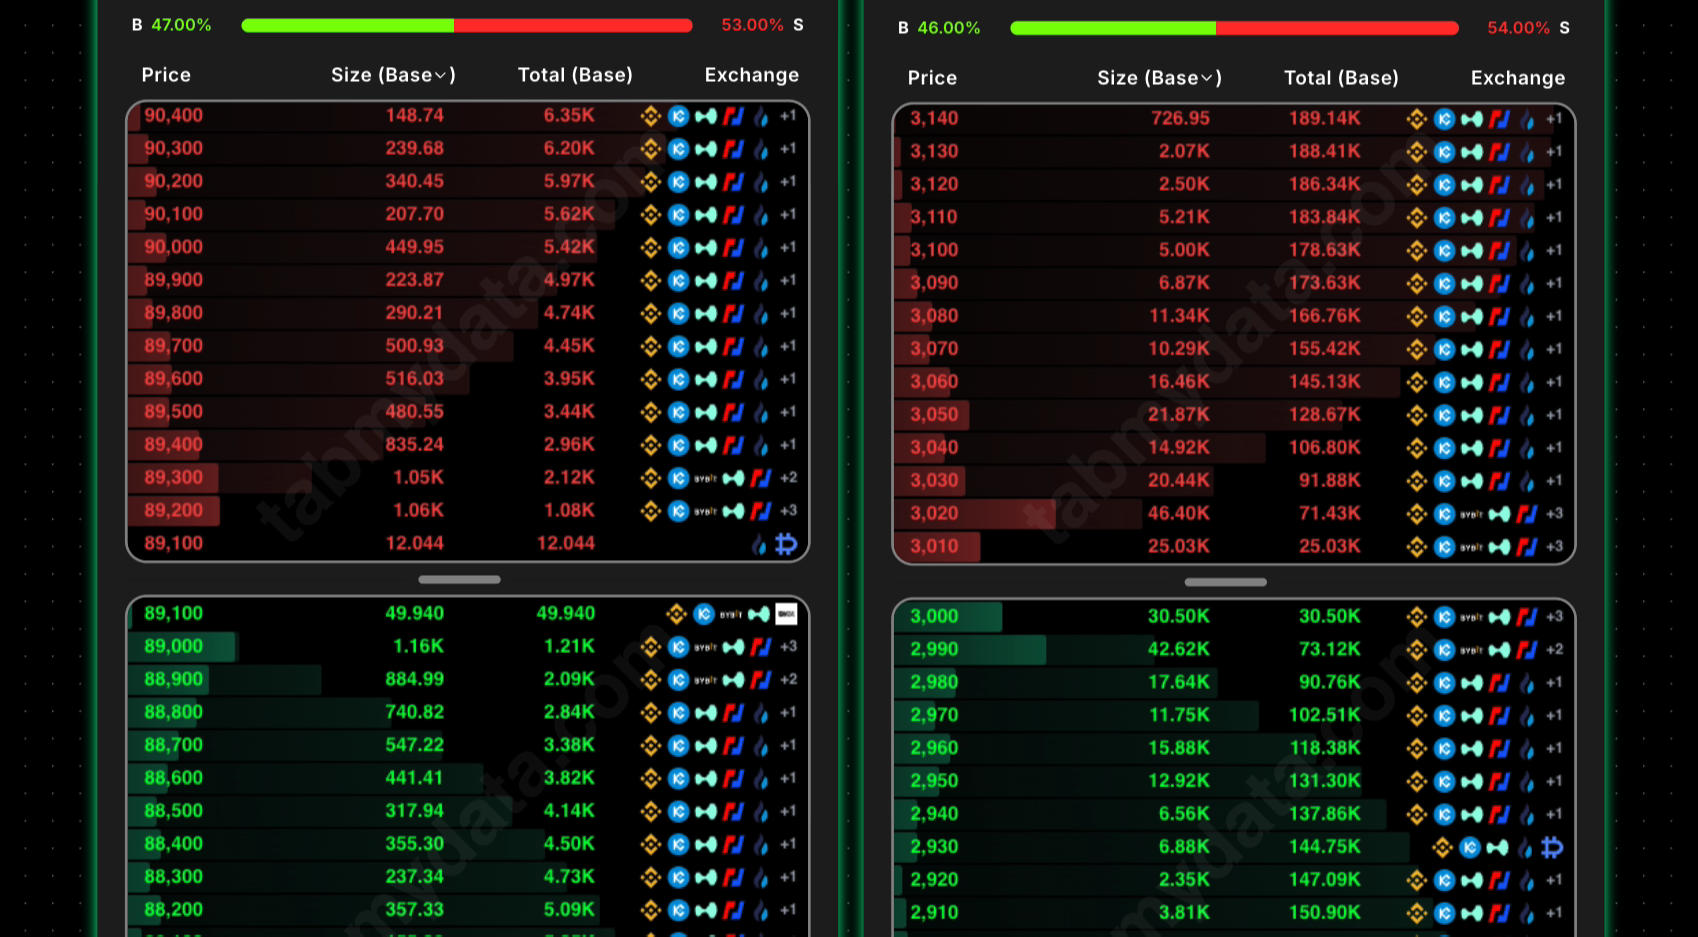
Understanding the Orderbook
The orderbook displays real-time buy and sell orders from multiple exchanges. Green bars represent bids (buy orders) and red bars represent asks (sell orders). The visualization helps you understand market depth and liquidity.
Selecting Assets and Exchanges
Click the "Select Assets" accordion to choose trading pairs and exchanges. You can select multiple exchanges and pairs to view combined order book data.
Manage Selected Assets
This section displays all selected trading pairs and exchanges for aggregation. To remove an item, simply click the minus (-) icon on the right.
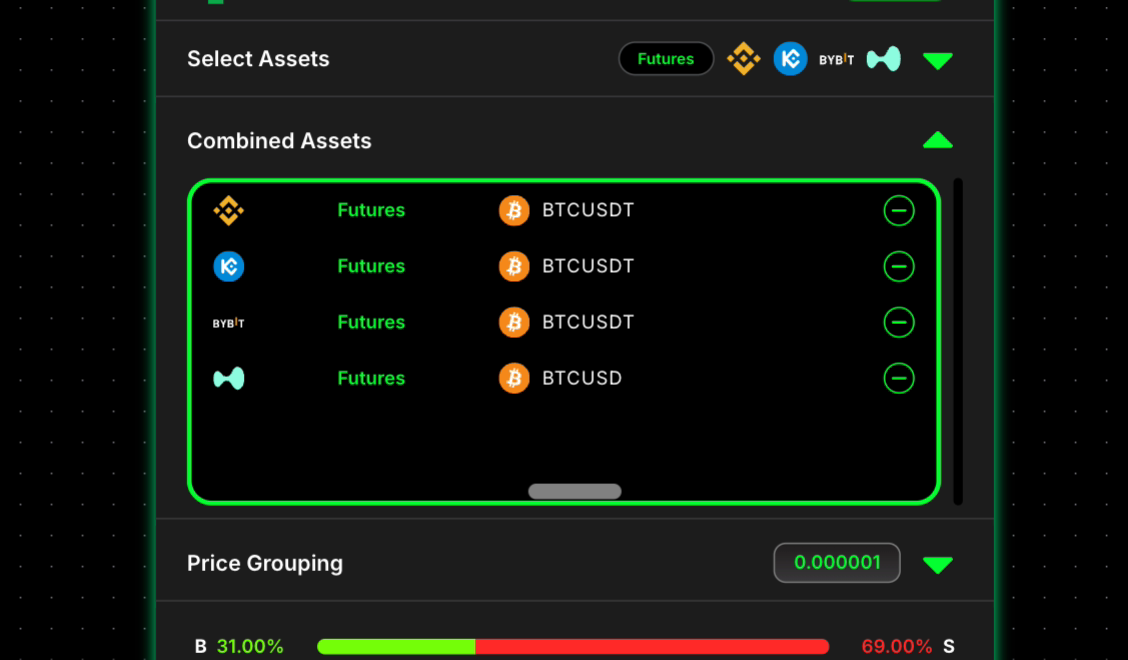
Price Grouping
Use the grouping slider to aggregate orders at similar price levels. This helps you see the overall market structure more clearly by reducing noise from small orders.
Interpreting the Combined Orderbook
The depth chart visualizes cumulative order volume at each price level. Larger bars indicate stronger support or resistance levels where significant trading activity may occur.