Workspaces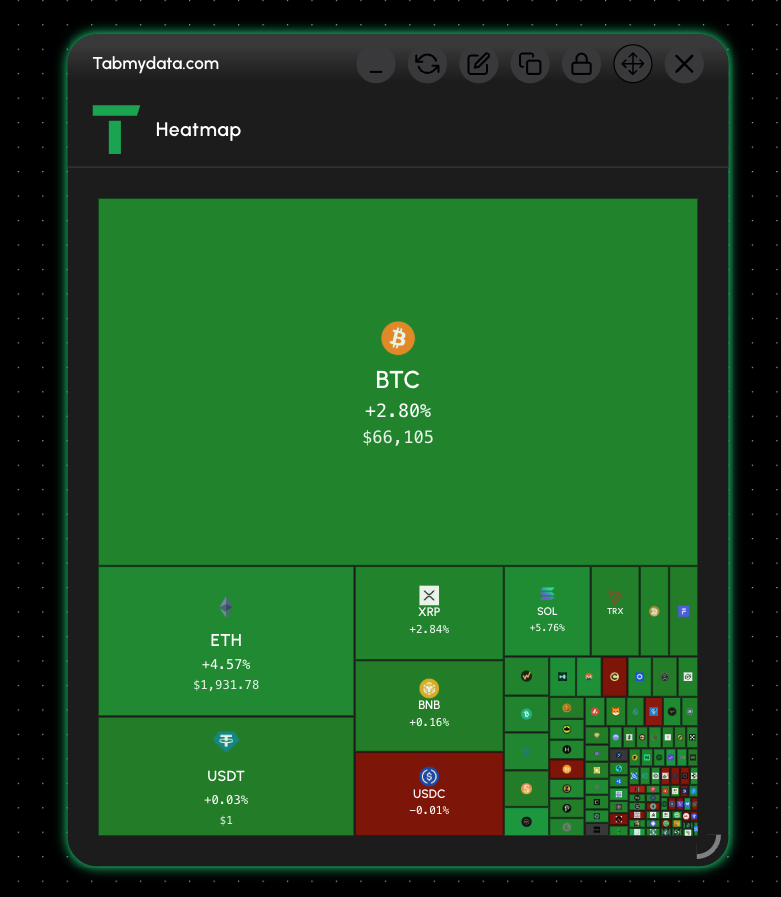
Heatmap Tab
Visualize order book depth over time as a color-coded heatmap.
Tabmydata Docs
What is the Heatmap?
The Heatmap tab renders order book liquidity as a heat map over time, so you can see where large clusters of bids and asks have been accumulating. Brighter areas indicate higher order density.
Adding the tab
Click "+" → select Heatmap. The tab will begin building the heatmap from the current moment forward.
Reading the heatmap
The Y-axis is price and the X-axis is time. Sudden disappearance of a large cluster usually indicates a filled or cancelled order. Hover over any coin to see a quick summary of its current price, 24h change, market cap, and rank. You can also resize the tab by dragging the handle in the bottom-right corner.